A recent economic study has revealed how much every American could have if $79 trillion in accumulated wealth were equally redistributed.
On April 2—dubbed Liberation Day—President Donald Trump pledged to “Make America Wealthy Again” by announcing sweeping tariffs on foreign goods. He argued that American workers had “suffered gravely” from economic policies that “ripped them off for more than 50 years.”
However, Independent Vermont Senator Bernie Sanders countered that the Republican Party is simultaneously working on tax breaks for billionaires while cutting essential programs for working families.
A landmark study by the RAND Corporation, a nonprofit think tank, sheds light on this inequality. It found that nearly $80 trillion in wealth generated by 90% of American workers since 1975 has flowed to the top 1% instead.
The question remains: If this vast sum were redistributed, how much would each American receive?
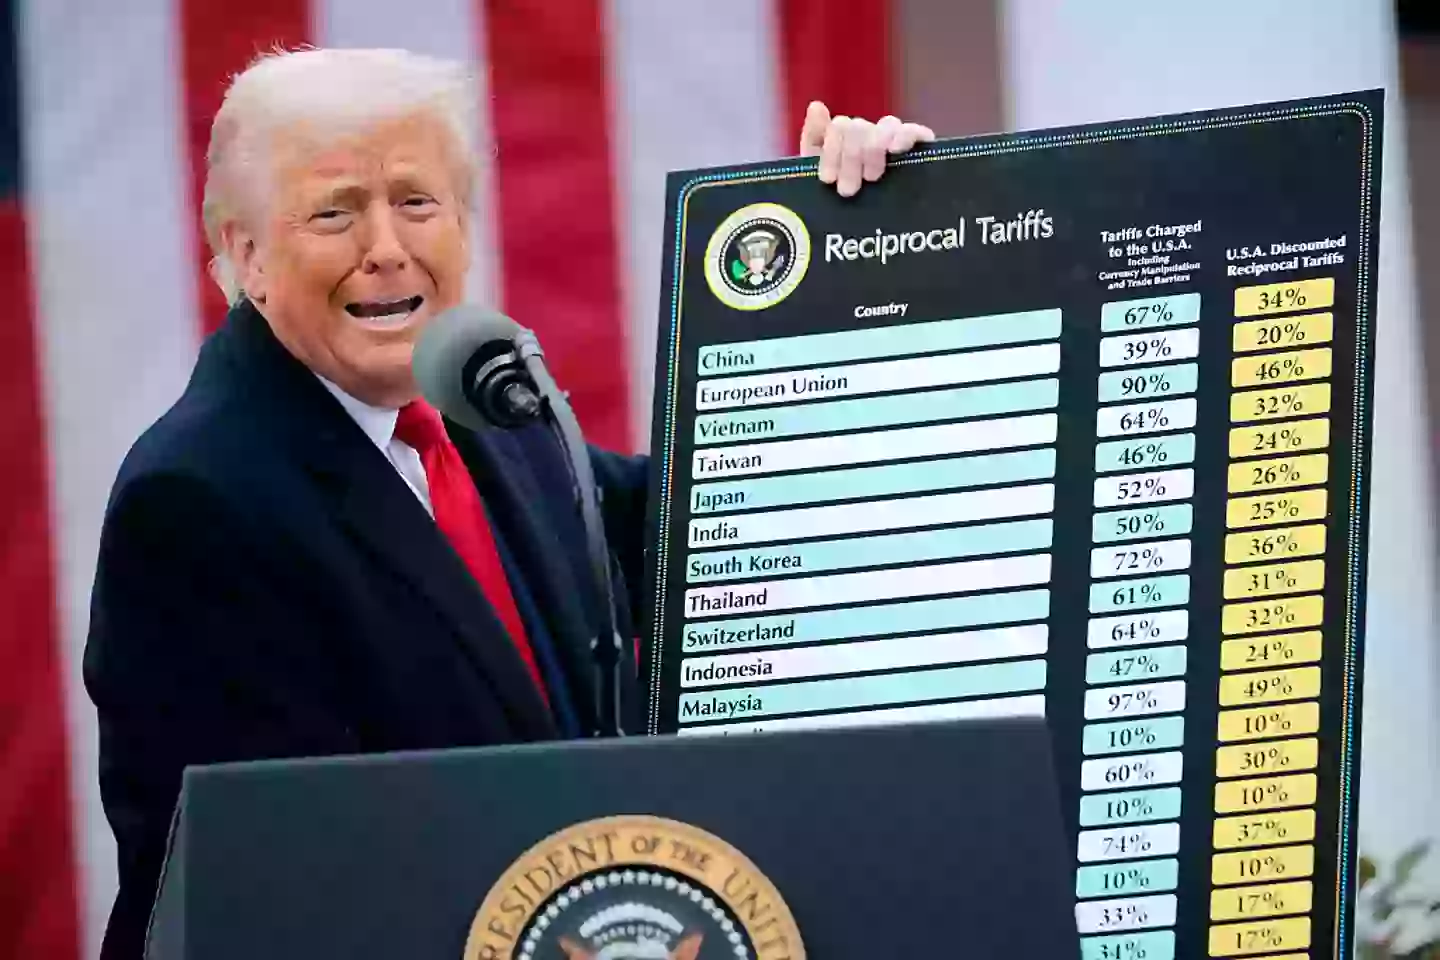
The president announced the new tariffs for countries around the world on Wednesday (Chip Somodevilla/Getty Images)
A recent study by the RAND Corporation has revealed that nearly $80 trillion in wealth generated by 90% of American workers since 1975 has instead gone to the top 1%. The findings expose the staggering economic disparity caused by rising inflation and the cumulative cost of lost wages, with the share of income for the bottom 90% steadily declining—while the top 1% saw their real income grow.
On average, this wealth shift equates to $1.58 trillion lost per year over five decades.
Had this wealth been fairly distributed, the impact on American workers would have been profound. In 1975, when the U.S. workforce numbered 79.3 million, each worker would have taken home an additional $19,924.38 per year. This data highlights just how wide the gap between working-class and upper-class Americans was even back then.
And despite economic growth, the situation hasn’t improved much in recent years—a stark reminder of the deepening inequality that continues to shape the U.S. economy today.
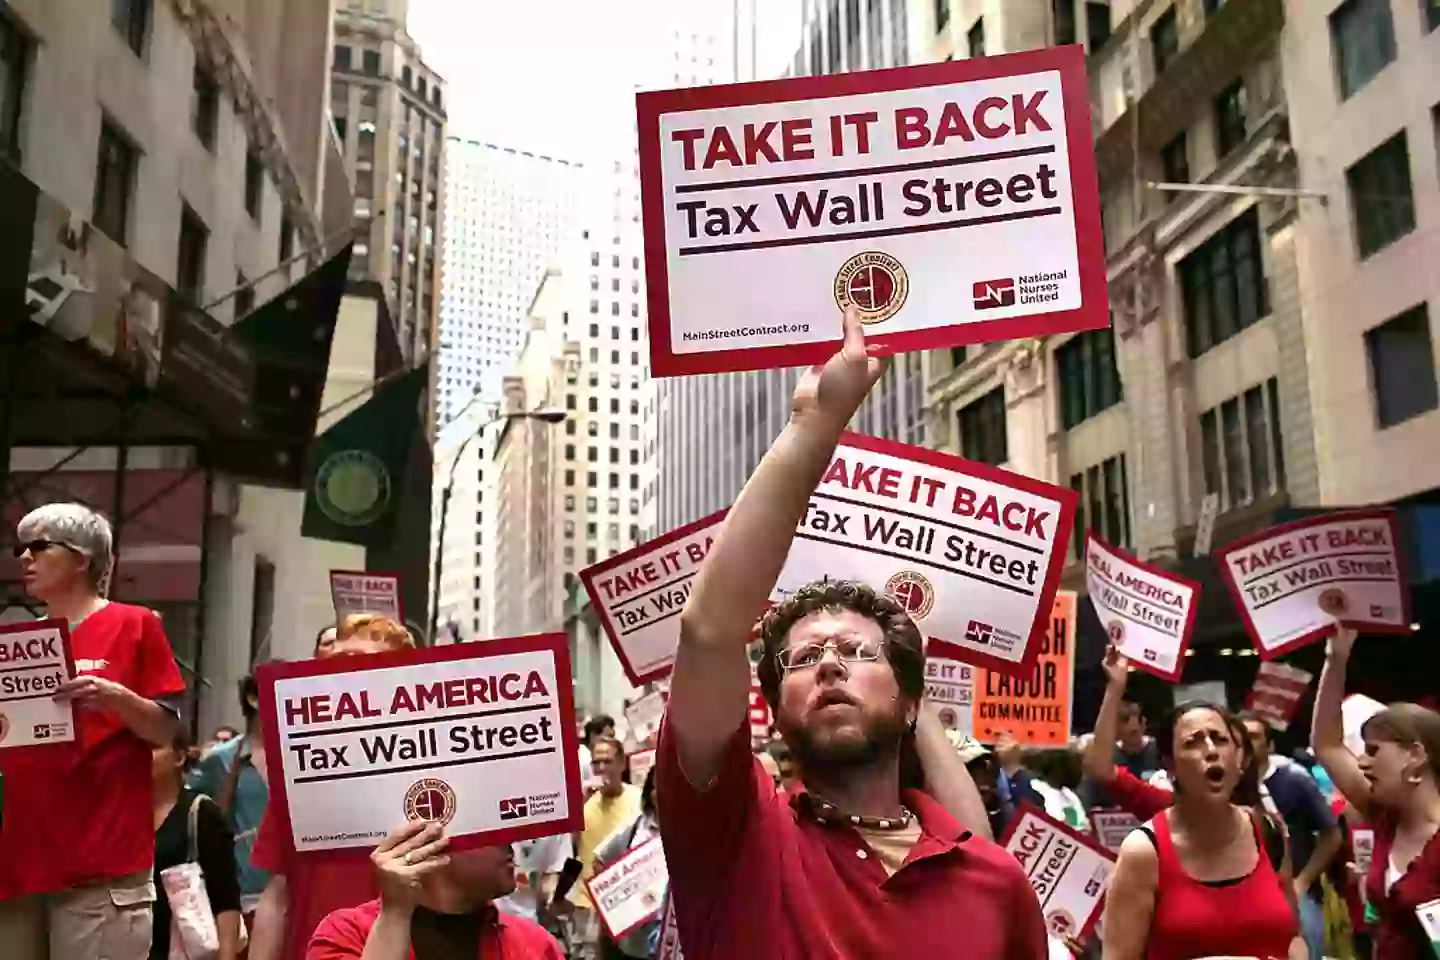
Activists took to the streets in 2011 to protest against the inequality (Spencer Platt/Getty Images)
The RAND Corporation’s study on economic inequality reveals just how much American workers have lost over the decades due to wealth redistribution favoring the top 1%. The numbers are staggering:
-
1985: With a workforce of 108 million, each worker would have earned an extra $14,629.93 had wealth been more evenly distributed.
-
1995: As the workforce grew to 129.7 million, the potential earnings loss per worker was $12,181.96.
-
2005: With 154.4 million workers, the shortfall remained significant at $10,233.16 per worker.
-
2018: Despite a workforce of 156.3 million, workers were still missing out on $10,108.77 annually.
The data underscores how economic disparity has persisted—even as the workforce has expanded.
Commenting on the findings, Senator Bernie Sanders stated: “Over and over again, my Republican colleagues have expressed their deep concern about the redistribution of wealth in America, and they are right. The problem is that it has gone in precisely the wrong direction.”
He went on to call today’s levels of income and wealth inequality in the U.S. “not only morally unjust but profoundly damaging to our democracy.”

Bernie Sanders has said the wealth inequality in the US is a ‘crisis’ (Samuel Corum/Bloomberg via Getty Images)
The author concluded in the study that if we had the same income distribution as in 1975, the majority of workers could have received an extra $3.9 trillion in 2023, which Sanders said equates to a $32,000 a year rise among the bottom 90 percent.
“Given this reality, we cannot provide another $1.1 trillion tax break to the top 1 percent by making massive cuts to healthcare, housing, education and nutrition assistance as President Trump and Republicans in Congress want to do,” Sanders continued. “We must do the exact opposite.”